Peak Detection Parameters
The parameters for peak determination consist of the following seven elements.
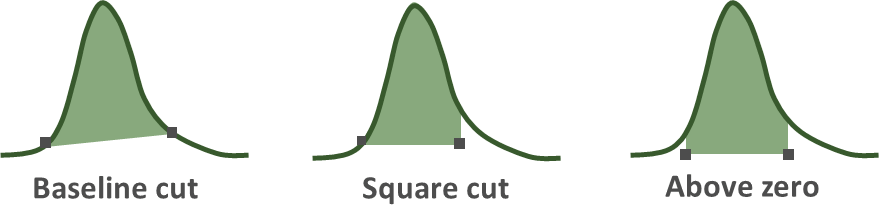
- Edge Detection Mode
- This is a parameter that defines the shape of the peak. You can choose from the following three shapes.“Baseline cut” defines the peak shape using an assumed baseline. This mode shapes the peak by cutting off the baseline. “Square cut” determines the peak boundaries by estimating the peak’s ends from the baseline and adjusting the peak’s lower boundary to align with the side of lower intensity. “Above zero” is similar to “square cut” in that it estimates both ends of the peak from the baseline, but the lower boundary of the peak is set to zero intensity.
- Smoothing Points
- This is a parameter for smoothing the chromatogram. A chromatogram is drawn with line segments connecting points that represent intensity information over time.The value given in Smoothing Points indicates the number of points to average the intensity at each point. If this parameter is set to 0, no smoothing will be performed, and by increasing the value, you can increase the degree of smoothing.For example, setting this value to 3 means that the intensity of each point on the chromatogram is recalculated by averaging it with the point itself and the three points before and after it, totaling seven points, to smooth out the overall intensity profile.
- Minimum Peak Distance
- Defines the range to examine adjacent peaks around local maximum points of the chromatogram after smoothing. The value given by “Minimum Peak Distance” is the number of points from the top of the peak. Local maximum points included within the distance by this parameter are considered to be the same peak.This value should be decreased to facilitate strict evaluation of shoulders or splits in peaks, thereby distinguishing them as separate peaks.
- Sensitivity for Inflection Point
- Determines how much the peak spreads forward and backward in time from the peak top (peak position) determined by the parameters above. To determine the left and right endpoints of a peak, this parameter evaluates the magnitude of the angular change in the line segments before and after each point. The value should be set 0 (as minimum sensitivity), where only a local mininum point will become the endpoint, and should be set 100 (as maximum sensitivity), when the line segments before and after are straight lines and no fluctuations are observed.When “Expand Search Regison” is not active, the algorithm selects the closest point to the peak top that meets the “Sensitivity for Inflection Point” criteria as the endpoint. If “Expand Search Region” is activated, the algorithm extends its search within the “Minimum Peak Distance” range to find an endpoint, prioritizing points that satisfy the sensitivity criteria with the lowest intensity, ensuring a more accurate delineation of the peak’s boundaries.
- Relative Abundance Filter
- When the intensity value of peaks detected using the parameters so far is expressed as Relative Abundance, and the values do not satisfy the Relative Abundance Filter value, these peaks will be excluded from the detected peaks.
- Expand Search Region
- When searching for the left and right end points of a peak from the peak top, this determines whether to end the search at the first end point candidate found (when disabled), or to search for the optimal end point within the “Minimum Peak Distance” range (when enabled). Please refer to “Sensitivity for Inflection Point” for details.