Main Window Overview
The window that appears when Cascade starts is called the main window. Here, we will describe the names and roles of each alphabet shown in the main window in the image below. For details on how to operate each window, see Operations .
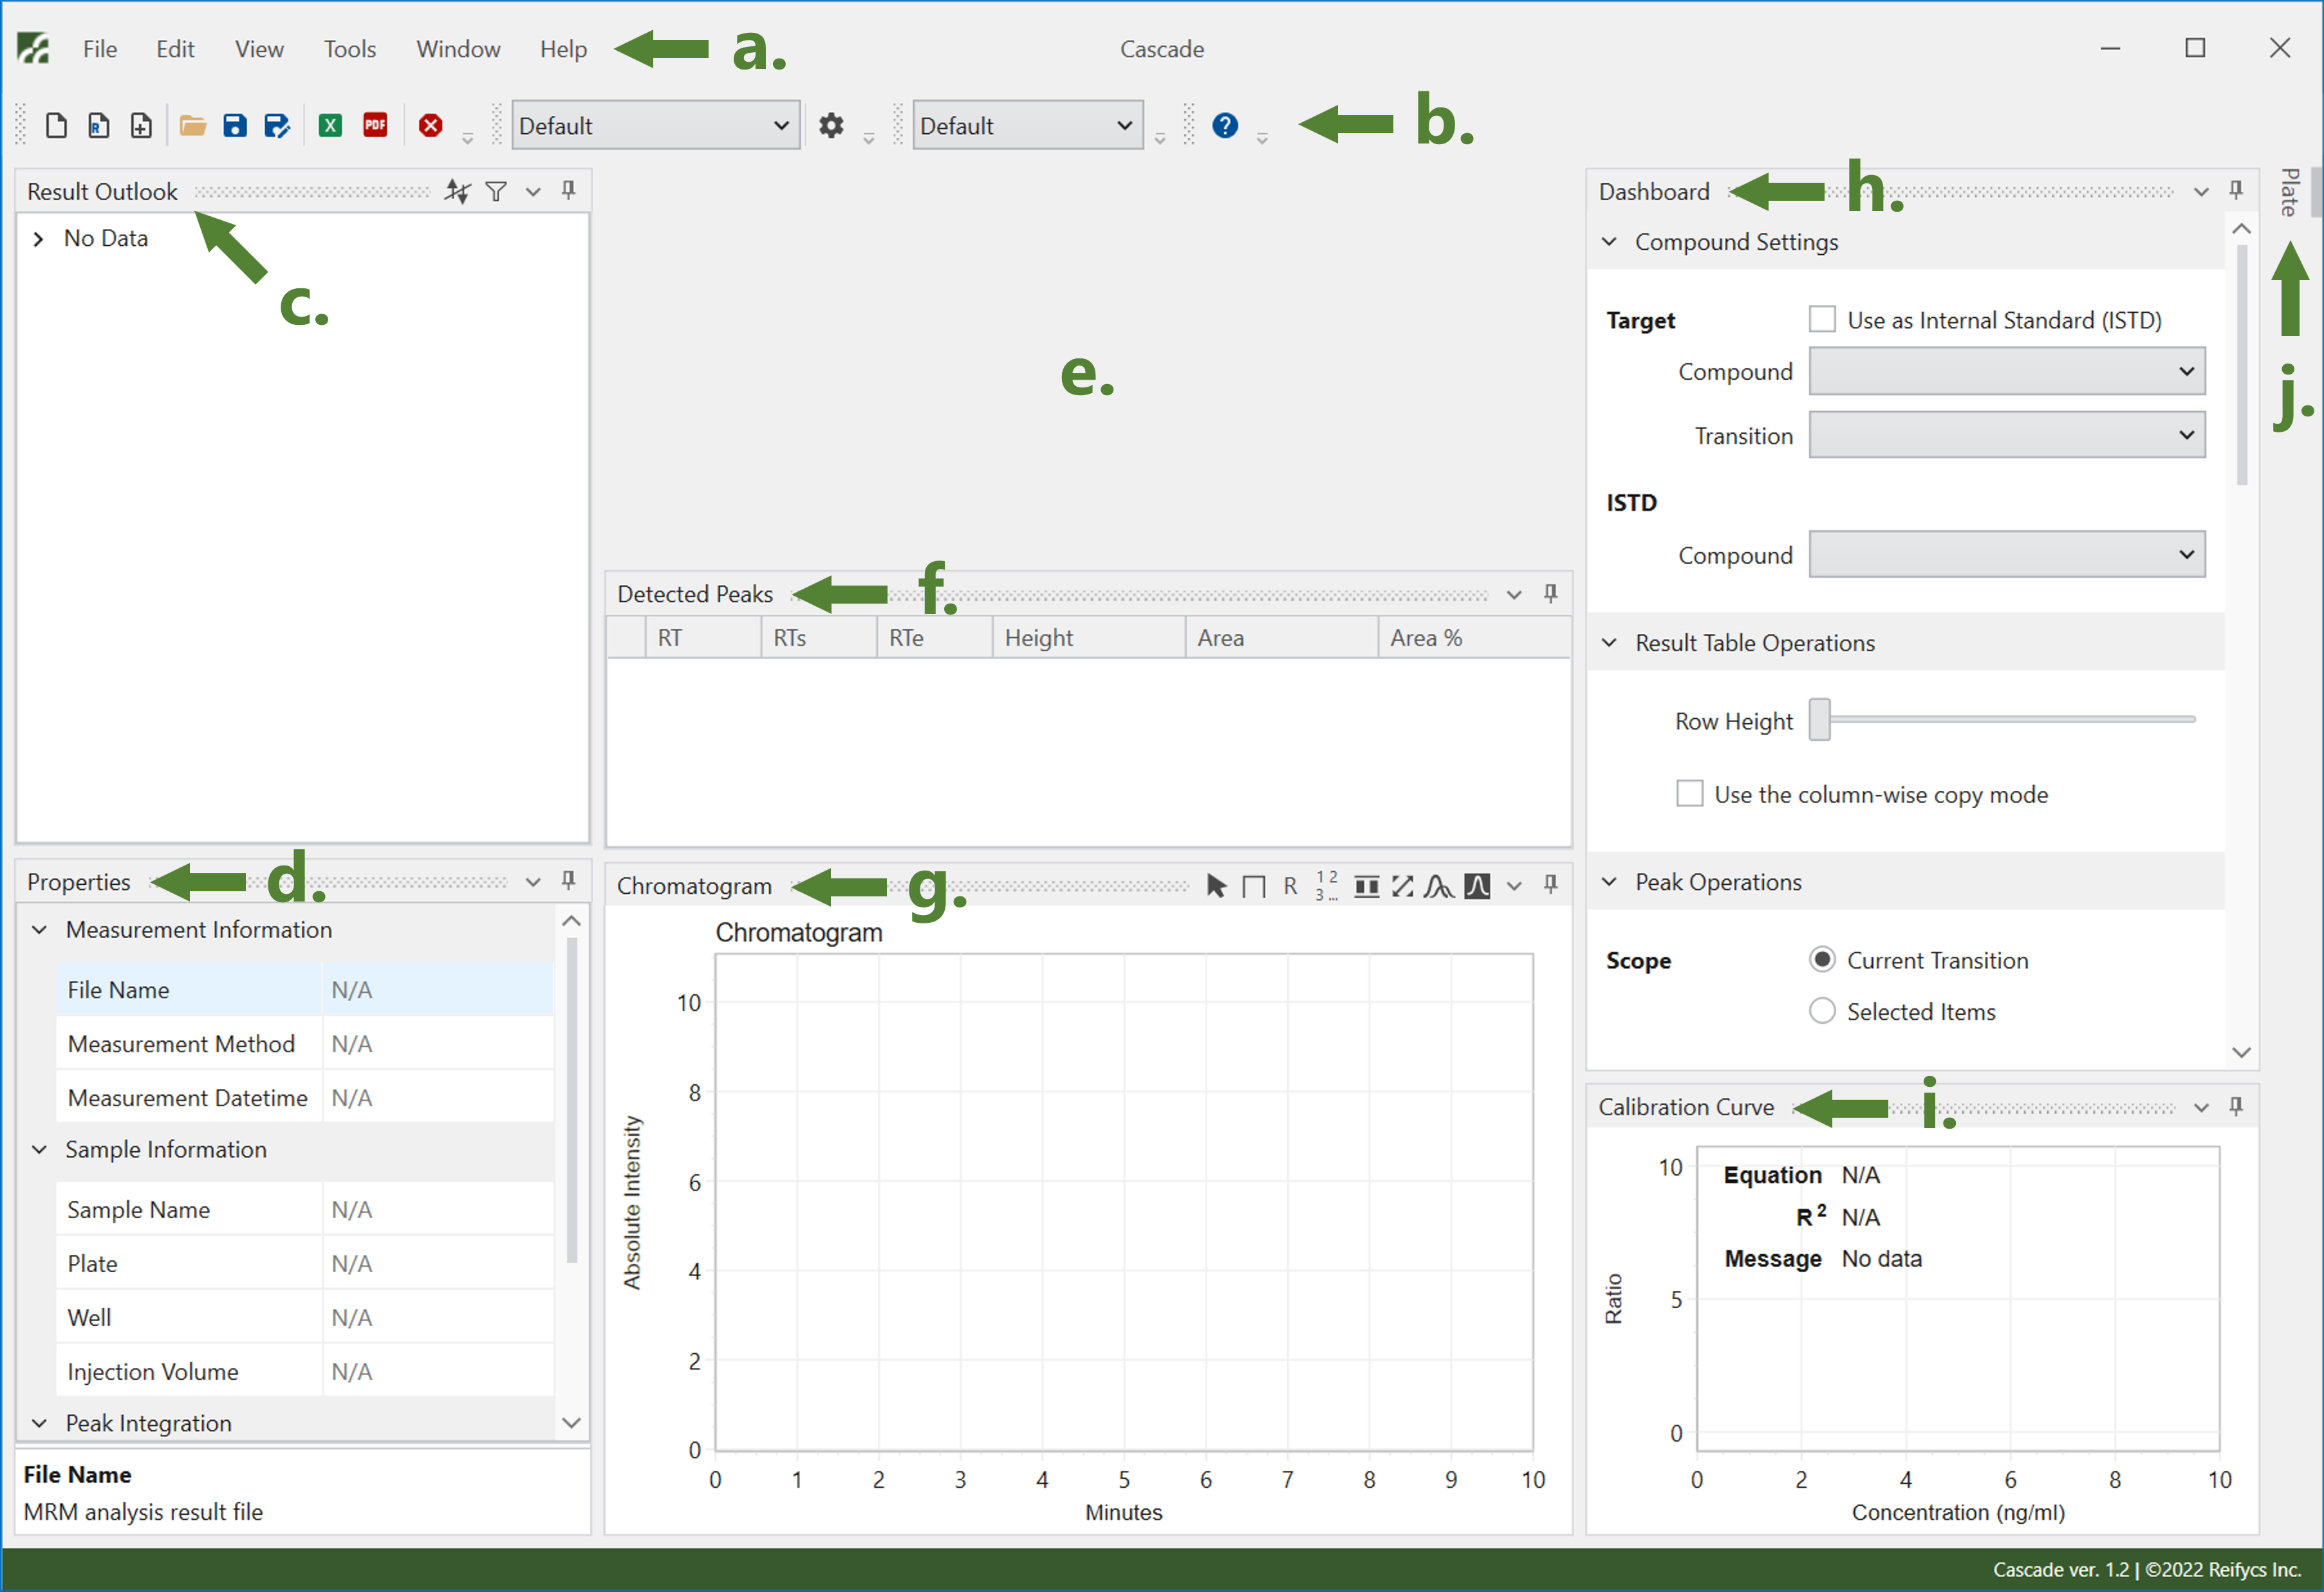
b. Toolbar
The toolbar contains frequently used menu bar functions and shortcut for selecting Analysis Template that defines Cascade’s analysis conditions.
c. Result Outlook Window
The Result Outlook window displays a list of measurement methods, compounds, and transitions (monitors) measured for each compound. Compounds set as internal standard are indicated with the ISTD badge. The ISTD setting can be changed in Dashboard. Additionally, transition radio buttons are provided to select the transition to quantify each compound.
d. Properties Window
The Properties window displays measurement information and analysis parameters for the selected sample, depending on the selection status of the analysis results. For details on what each item in this window indicates, please refer to the explanations displayed at the bottom of the window on selected the item.
e. Workspace
This is where the analysis results are displayed. The results for each compound (Result Table) will be displayed here in tabbed view. Whether to display the compounds selected in the Result Outlook window in one tab or to display each compound as a separate tab can be set in the Preference window displayed by [Edit] - [Preference].
f. Detected Peaks Window
This window displays a list of peaks detected in the chromatogram of the selected sample. The selection status of the list is indicated by radio buttons, and checked peak is adopted as detection result. So it is possible to change the peak to be adopted by changing radio buttons.
g. Chromatogram Window
This window is for confirming and editing the chromatogram of the selected sample. If an internal standard (ISTD) is set for the selected sample, the chromatogram of the selected sample (target) will be displayed on the left side of this window, and the chromatogram of the ISTD will be displayed on the right side.
h. Dashboard Window
Dashboard allows you to change the settings of the compound selected in the workspace, set the chromatogram display, rerun peak detection, change the calibration curve options, etc. This window consolidates controls for items that are frequently changed during analysis.
i. Calibration Curve Window
If the analysis conditions are met, a calibration curve will be displayed in this window. The calibration curve type, weight, and details of displayed content can be changed in Dashboard.
j. Plate Window
The Plate window indicates the position of the measured sample on the well plate. By selecting a well displayed in this window, you can call up the results of the corresponding sample.