Preference
Preferences configure the behavior of the entire application. If you want to restore the default settings, click the “Load Default” button at the bottom left of this window.
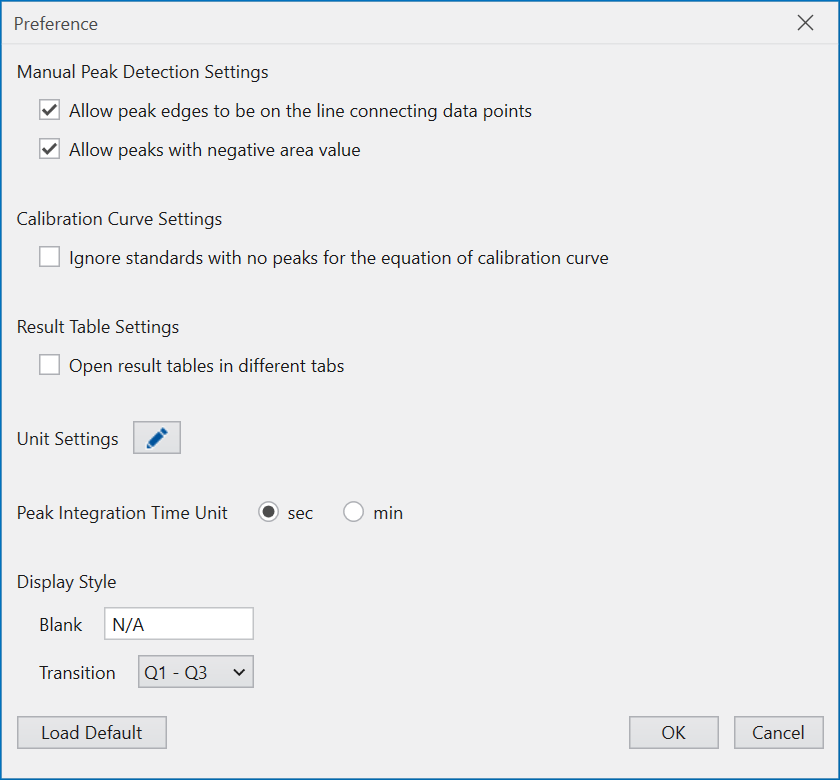
- Manual Peak Detection Settings
- A chromatogram is drawn with line segments connecting points representing intensity information over time. When editing peaks in the Chromatogram window, check “Allow peak edges to be on the line connecting data points” if you want to allow peak edges to be placed in the middle of the line connecting these points. This gives you more freedom to set the endpoints when manually editing the peak area. It is important to note, however, that even if the shapes appear similar, the peak areas may not match depending on the editing operation.If “Allow peaks with negative value” is checked, the baseline is allowed to cross the chromatogram curve, i.e. the peak area below the manually drawn baseline can be created over the chromatogram curve. Although this increases the degree of freedom in manually editing the peak area, there is the problem that peak regions may be created whose area becomes negative.
- Calibration Curve Settings
- When creating a calibration curve, if no peak area is detected in a standard sample, you can choose to exclude that sample and create a calibration curve from the remaining standard samples, or to generate an error and stop all concentration calculations without creating a calibration curve. If “Ignore standards with no peaks for calibration curve equation” is checked, a calibration curve is generated excluding samples with no detected peak area.Note that if this option is checked, there may be standard samples that are not used in the calibration calculation. Also note that if the check box is not checked, a calibration curve may not be created and concentration calculations may not be performed even if Standard is set.
- Result Table Settings
- If you want to open a different tab for each compound when displaying the Result Table, check “Open result tables in different tabs”. If you want to use only one tab and switch the display of the Result Table depending on the selection of the Result Outlook, make sure that this is not checked.
- Concentration Unit Settings
- Set the concentration units that can be used in quantitative analysis. Click on the pencil mark button to select the concentration unit that can be set. This unit setting affects the unit selection in Concentration in Rules and the candidates displayed in Calibration Curve Settings.
- Peak Integration Time Unit
- Set the unit of retention time when calculating the peak area by integration. This affects all peak area values displayed on the screen, including the Result Table, Detected Peaks, Chromatogram peak labels and the vertical axis of the Calibration Curve. It also affects the peak area values export by various file exports.
- Display Style
- Defines a string to be written when a cell in the Result Table has no value (Blank). It is also possible to define how the transition is displayed based on the Q1 value and Q3 value.