Display Conditions
The results analyzed by Cascade are displayed as compound name tabs (Result Table) in the workspace.
Display Conditions define how the analysis results are displayed in the Result Table.
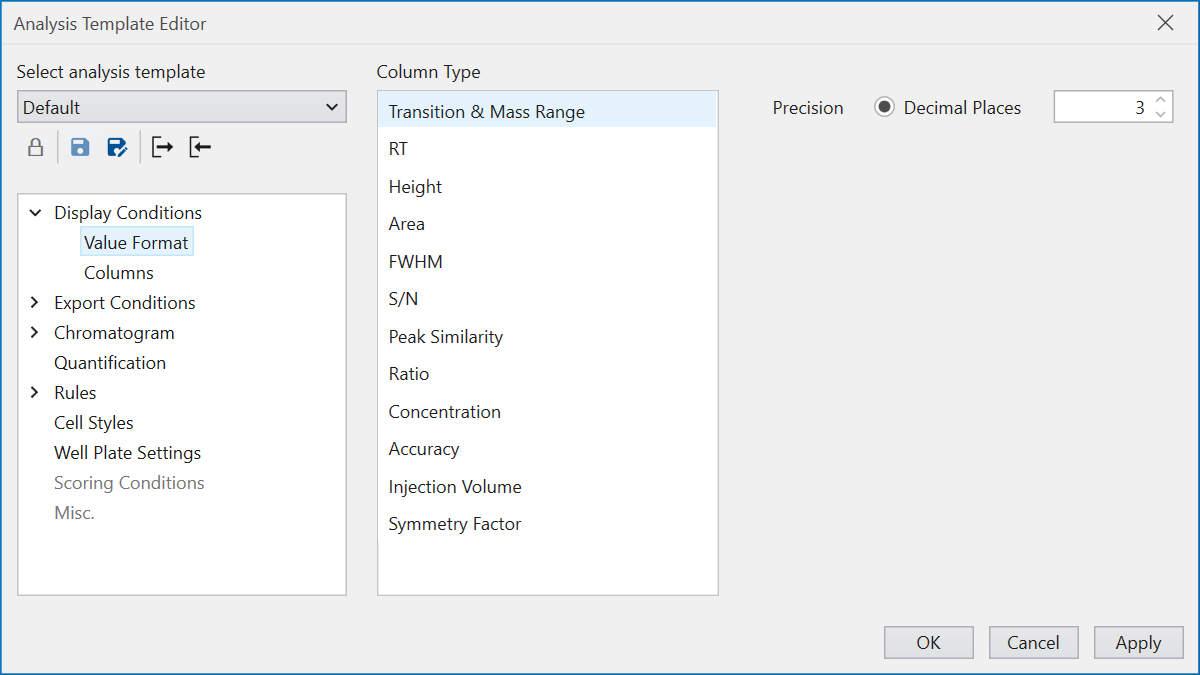
In ‘Value Format’, the display format for values
specified under ‘Column Type’ is set.
This configuration allows for tailored presentation styles
based on the selected column type.
Columns defines the columns to be displayed in the Result Table
and their order.
To enable checkboxes for selecting rows for export in
File Export,
ensure the ‘Display export setting column’ option at the top is checked.
This facilitates easier selection of rows for data export.
For columns not curently shown in the Result Table,
you can bring them into view by selecting them
under ‘Excluded Columns’ and then clicking the right arrow (>)
to move them to ‘Include Columns’.
If you want to hide it, do the opposite.
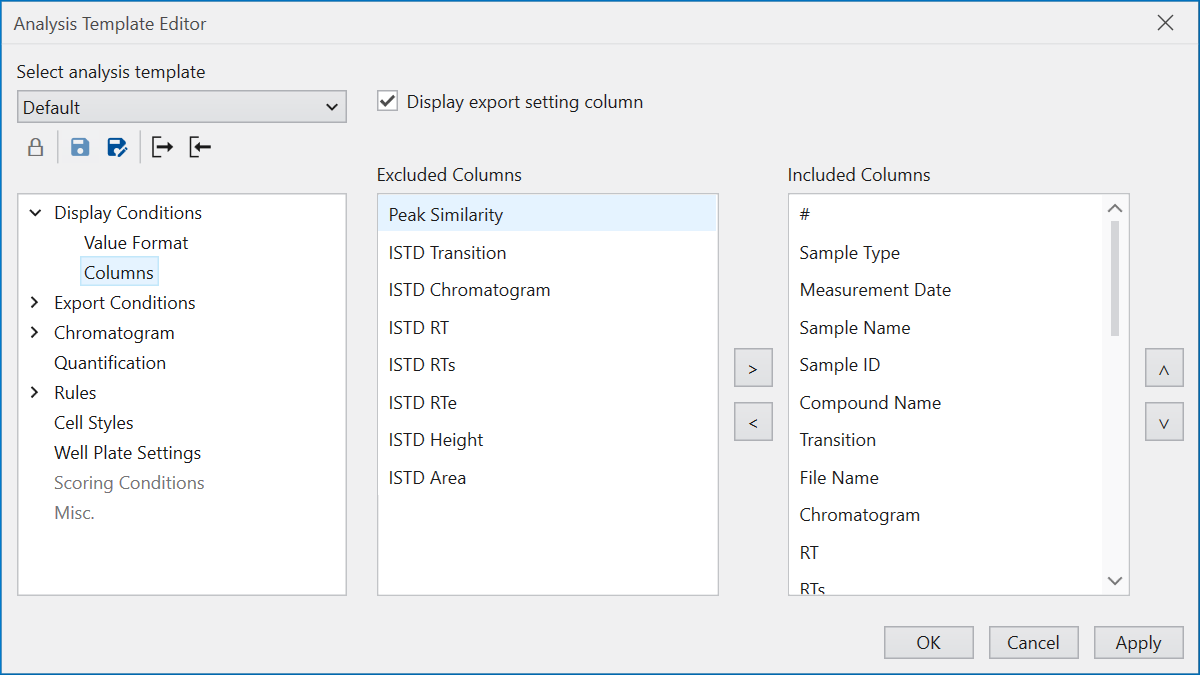
The sequence shown in ‘Included Columns’ also reflects
the display order within the Result Table.
You can change the order by selecting the Column
and pressing the up and down arrow buttons
on the right side of the screen.
To modify a column’s display name,
simply double-click on the column name
within ‘Included Columns’ or click on the pencil icon
that appears when hovering over the column.