Cell Styles
This section defines how cells in the Result Table are highlighted.
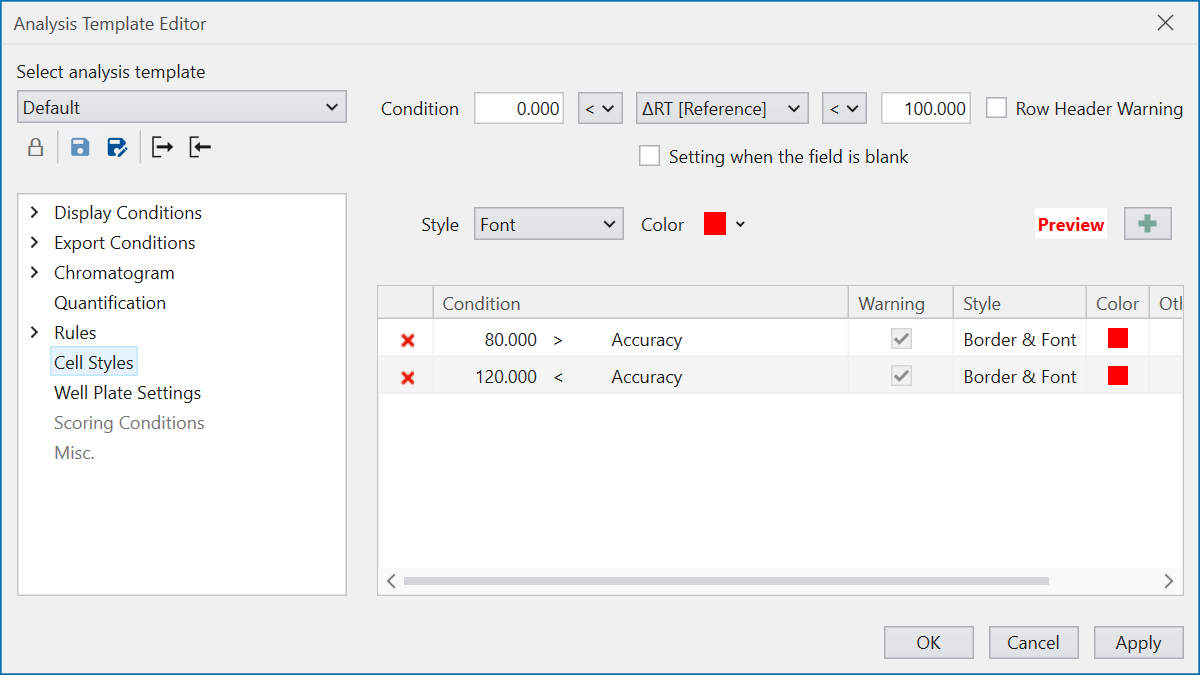
First of all, use the controls in “Condition” to set which column’s cells should be highlighted under what conditoins. For example, if you want to highlight cells corresponding to samples with a symmetry factor greater than 1 (selected peak is tailing), set as below.
Enter 1 in the left field. (The Number of digits follows Display Conditions .)
Select ‘<’ for the inequality sign on the left.
Select “Symmetry Factor” in the center target column.
Select ‘-’ for the inequality sign on the right.
In another example, if you want to highlight when no peak is detected and symmetry factor cannot be calculated, select “Symmetry Factor” in the center target column and check the “Setting when the field is blank” checkbox.
The “Row Header Warning” function is useful when you might not notice highlighted cells due to screen size or scrolling state. If you check this, icons will also be displayed at the beginning of the rows that contain highlighted cells, so you can avoid overlooking them.
Then, use the controls in “Style” and “Color” to set how to highlight cells that meet the conditoin. Previw on the right side how the settings here will affect the appearance of the cell.
After completing all settings, press the the “+” button to add the cell style.