Calibration Curve
This chapter explains the Calibration Curve window.
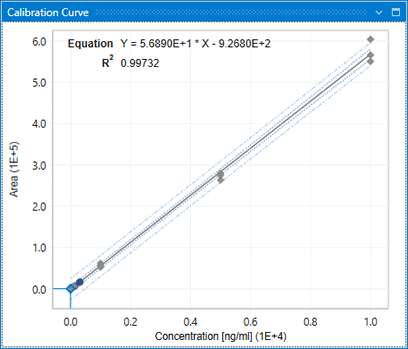
The Calibration Curve window is opened when there are enough standard samples defined in Result Table to create a calibration curve. It displays a graph of the calibration equation (calibration curve) calculated according to the settings of the type and weight of the calibration curve, and whether or not passing through the origin.
If you want to change the type and weight of the calibration curve, and settings for passing through the origin, make the settings in Calibration Curve Settings in Dashboard. If you want to exclude a specific standard sample plotted on the graph from the calibration curve calculation, click the plot (point) of the relevant sample and select the relevant row in Result Table, and uncheck the “Use as Calibration Point” checkbox in the Concentration column. By removing the check, the calibration curve will be calculated again excluding the relevant sample.