Column List
#
Displays the ID assigned to each analysis result.
Sample Type
Displays the type of sample when creating a calibration curve and performing quantitative analysis. The sample type is set to Unknown, Standard, or QC. To change the sample type, select the sample row you want to change the sample type and right-click to display the context menu.
Measurement Date
Displays the date and time when the corresponding sample was measuremed.
Sample Name
The sample name defined on measurement is displayed. Depending on the manufacturer or instrument, sample ID may be displayed as Sample Name.
Sample ID
The sample ID defined on measurement is displayed. Depending on the manufacturer or instrument, sample name may be displayed as Sample ID.
Compound Name
The compound name defined on mesurement is displayed.
Transition
Q1 and Q3 values are displayed for SRM/MRM analysis, and m/z value is displayed for SIM analysis. Even with SIM analysis data, the measurement threshold (m/z tolerance) may be displayed along with the m/z value depending on the instrument and the data being read.
File Name
Displays the file name of the measurement data file that corresponds to the result.
Chromatogram
Displays the chromatogram of the selected transition of the target compound.
RT
Displays the peak top retention time (RT) of the selected peak among the peaks detected on the chromatogram.
RTs
Displays the start time of the selected peak (the left edge of the peak).
RTe
Displays the end time of the selected peak (the right edge of the peak).
Height
Displays the peak top intensity of the selected peak.
Area
Displays the peak area of the selected peak.
FWHM
Displays the half maximum full-width (min.) of the selected peak.
Local Maxima
Displays the number of local maxima in the selected peak. If this number is large, the peak will have a jagged shape.
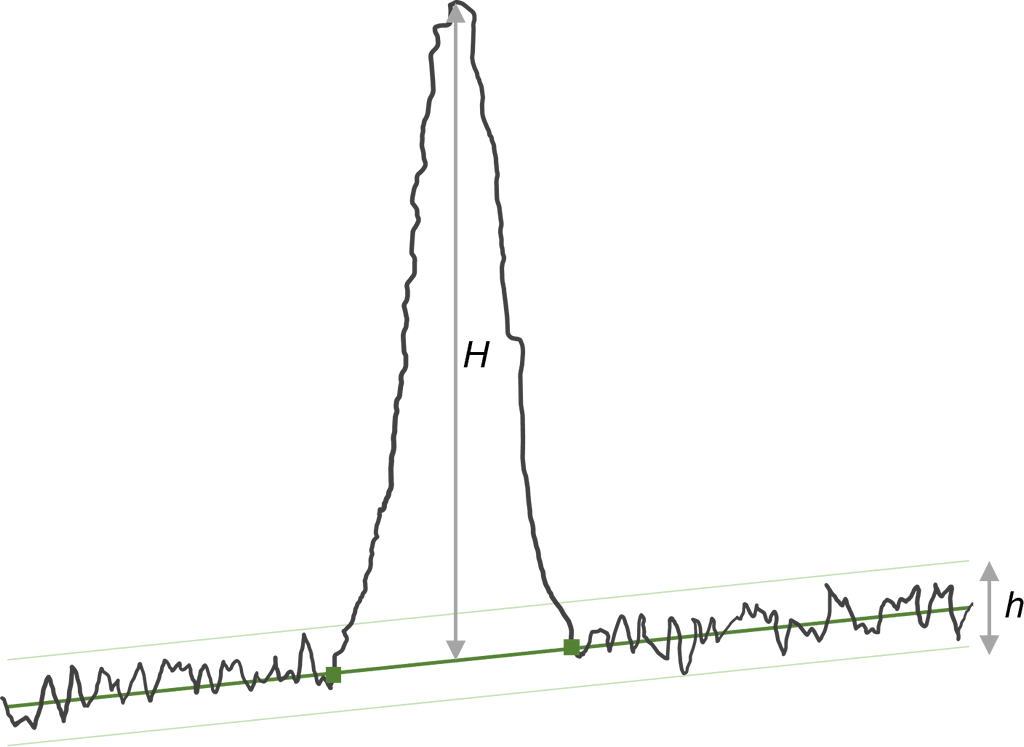
S/N
This displays the sekected peak’s Signal-to-Noise (S/N) ratio, calculated as follows to ensure the reliability of peak detection.
ΔRT [Reference]
Displays the difference in RT between the reference sample peak and the selected peak. The reference sample can be set from the right-click menu, and the letter R will be displayed in the header of the sample row set as reference.
Peak Similarity
Displays the similarity between the reference sample peak and the selected peak.
ISTD Transition
Displays transition information of internal standard compound (ISTD). Internal standard compound can be set at Compound Settings or ISTD Manager.
ISTD Chromatogram
Displays the chromatogram of the selected transition of the internal standard compound (ISTD).
ISTD RT
Displays the RT value of the internal standard compound.
ISTD RTs
Displays the RTs value of the internal standard compound.
ISTD RTe
Displays the RTe value of the internal standard compound.
ISTD Height
Displays the Height value of the internal standard compound.
ISTD Area
Displays the Area value of the internal standard compound.
Ratio
Displays the ratio of the Area values of the target compound and the internal standard compound.
Concentration
Displays the concentration value set for the sample. The calibration curve is created based on these values given to the standard samples. By unchecking the checkbox displayed in this cell, you can create a calibration curve excluding that value. This value can be changed by double-clicking the cell to switch to edit mode, or by pasting the previously copied value.
Calc Concentration
Displays the concentration value calculated from the calibration curve.
Accuracy
Displays the accuracy of the concentration value calculated from the calibration curve.
Plate
Displays the name of the plate where measured sample was placed.
Well
Displays the well position where measured sample was placed.
Expected RT
If the RT value at which the compound is expected to be detected during measurement has been defined, that value will be displayed.
Measurement Method
Displays the measurement method name or file name used for the measurement.
ΔRT [Expected]
Displays the difference between Expected RT and the selected peak RT.
Injection Volume
Displays the sample injection volume defined on measurement.
Polarity
Displays the polarity defined on measurement.
Mass Range
Displays the scan filter mass range used when creating virtual SIM data. The value is displayed only when the original data consists of multiple scan filters.
Symmetry Factor
Displays the symmetry factor value of the selected peak. The method to calculate the symmetry factor value is as follows.
Peak Count
Displays the total number of peaks detected on the chromatogram.